This guide takes four steps, demonstrating an overview of the whole flow and connection between four tools to build a photo map. This guide will hit the main points and highlight how the tools connect up with open data
Introduction
Recently, we organized a fun skill share with Map Kibera, and then again with Transparent Chennai. The idea is to use OpenStreetMap and TileMill to create an interactive photo map. Here’s the simple result from working with Map Kibera.
Want to learn to create something like this? This guide takes four steps, demonstrating an overview of the whole flow and connection between four tools to build a photo map. This guide will hit the main points, highlight how the tools connect up with open data, and I’ll just link to other resources for the details on how to use each.
Upload Photos to Flickr
- What you need: A photo of a place to map.
- What you get: Link to the photo page and photo preview.
- Learn more: Flickr Help
If you don’t have a Flickr account, create one, it’s an easy way to share images. Upload a photo of a place. For our example, we uploaded this photo of the iHub in Nairobi, taken during the Uchaguzi election project. We created a Map Kibera group to hold all our collective photos.
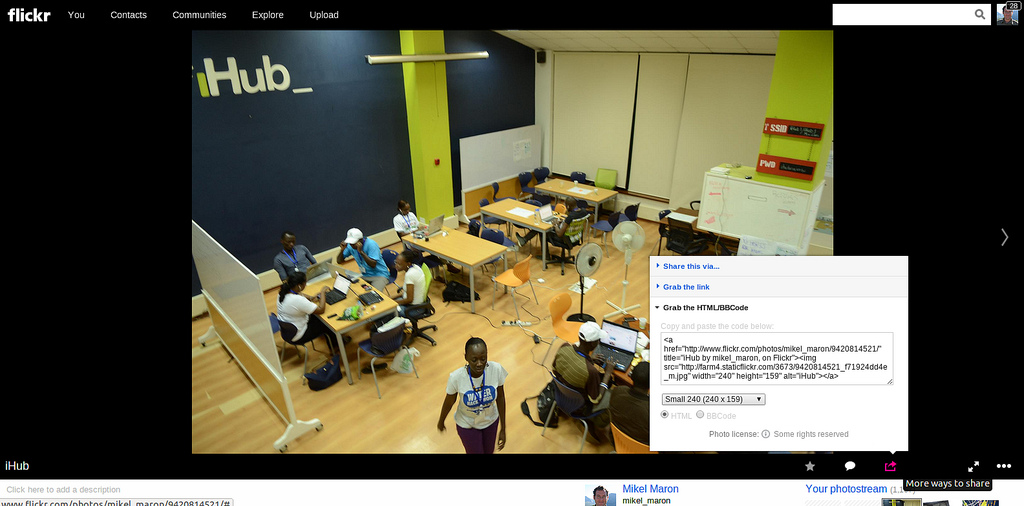
Credit: Mikel Maron, Ground Truth Initiative
From your photo page, click the Share button, and then the Grab the HTML/BBCode panel. Select a “Small” image size, and copy/paste the HTML code into a text editor/word processor. We need only the image link, which is within the tag.
The result you should have is a link to the photo page, and the photo preview. Something like:
https://www.flickr.com/photos/mikel_maron/9420814521/
https://farm4.staticflickr.com/3673/9420814521_f71924dd4e.jpg
Edit OpenStreetMap
- What you need: Location of your photo.
- What you get: OpenStreetMap feature linked to the image.
- Learn more: LearnOSM
Now, over to OpenStreetMap. Sign up if needed, and review the basics in LearnOSM. Also, try the iD Walkthrough: navigate to an area, click Edit (specifically, click the down arrow, and select “Edit with iD”), and follow along the editing tutorial.
Now open the View tab again. Enter the name of the location of your photo, and search. In our case, it’s “iHub”. Look through the search results, and find the correct feature, there might be more than one feature with that name, and then click View Details to open the browse page for that node. This page shows the location and tags for the feature, and in the lower right, click the Edit Node link.
Often you’ll need to add a new feature in OSM, rather than add to an existing feature. Check out the other guides to learn more.
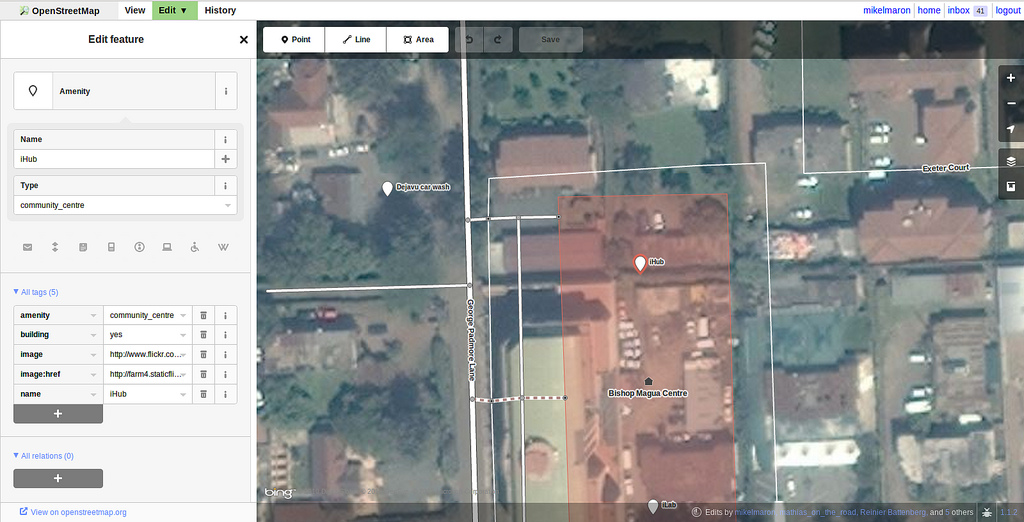
Credit: Mike Maron
In the left panel, click All tags, then the +, to add the tags to link the image on flickr. Add “image”, then the link to the Flickr photo page. It will look like:
image=https://www.flickr.com/photos/mikel_maron/9420814521/
Click Save, add a commit message, and click Save again.
Caveats
Important: When you are taking photos, make sure to record which photo goes with which object! It can get confusing if there’s a lot.
Extraction with Overpass Turbo
- What you need: A Deep Breath (take one now!)
- What you get: A GeoJSON file containing images and locations.
- Learn more: Overpass Turbo wiki page
The OpenStreetMap website presents one view of the data you contribute. The powerful thing about OSM is that you can take the data and use it however you like. Extracting the data from OSM itself, for use in another tool, is what this step is about.
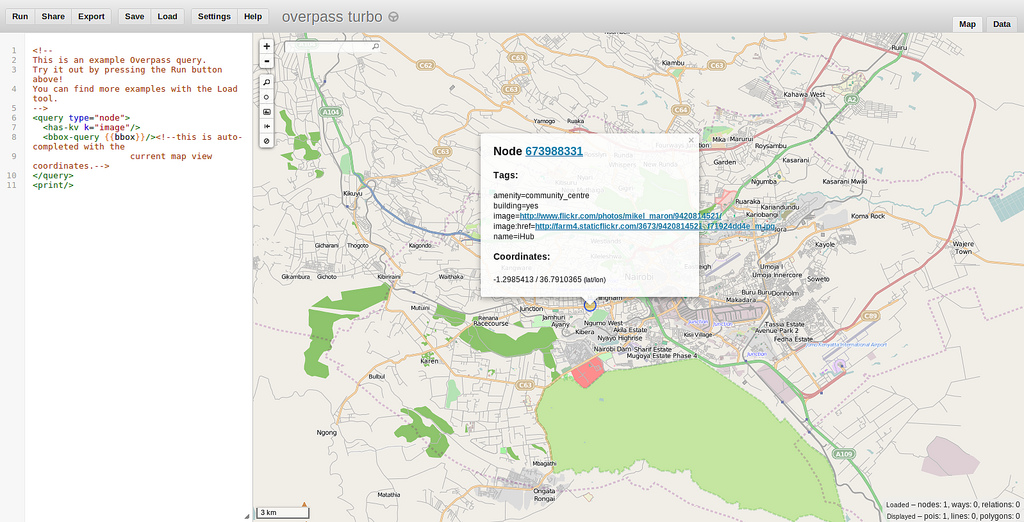
Credit: MIke Maron
Open Overpass Turbo with the template to search for nodes with key “image”. You can find links for other tags by exploring TagInfo, another great tool I’ll cover in a later skill share. The interface has two panels, on the left the “Query” and the right the “Map”. Search and navigate the map to the area where your features are located. For us, the is “Nairobi”.
The query to do the extraction can get complicated; you’ll see the template settings on the left, looking something like.
{{key=image}}
{{type=node}}
Now click Run. Overpass will work for a few seconds, and then display the results on the map. You can click the points to get more info on each feature. Now click the Export menu, then the Data panel, and finally GeoJSON. This should trigger a download of the results, and a display of the results in the dialog (some browsers won’t automatically download, so copy/paste the GeoJSON from the dialog into a file, and save locally). Note the location of the GeoJSON file, we need it for the next step.
Groom GeoJSON
- What you need: The GeoJSON created with Overpass Turbo.
- What you get: GeoJSON with image preview links
To make our map, we need not only links to the Flickr page for the uploaded images, but also a link to the preview image itself. The GeoJSON Flickr Groomer is a simple tool to create those links.
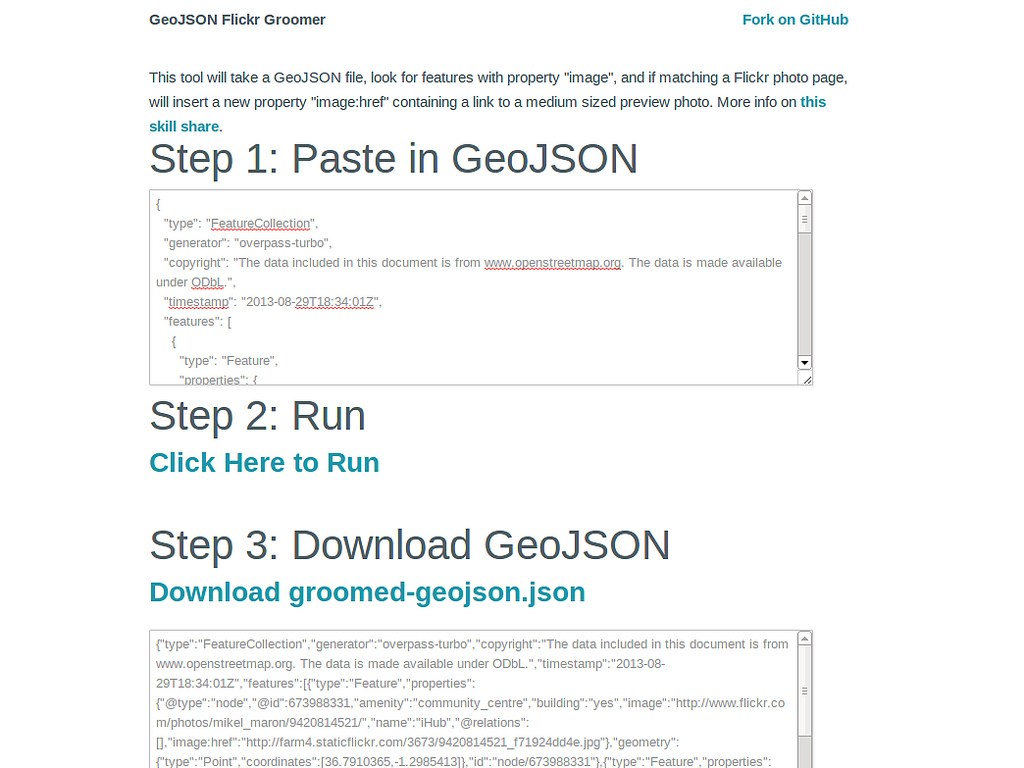
Credit: Mikel Maron
Open the GeoJSON file downloaded from Overpass Turbo in your text editor. Copy all the content, and paste into the first text box. Click here to Run, then Download groomed-geojson.json. Note the location of the GeoJSON file, we need it for the final step.
Make a Map With TileMill
- What you need: The GeoJSON modified by GeoJSON Flickr Groomer.
- What you get: An interactive map (finally!)
- Learn more: TileMill Crash Course and MapBox Help
TileMill is a tool for designing maps. There’s a lot to it, so do check out the Crash Course, and other guides on the TileMill site. Install TileMill, start it up, and create a new project; uncheck Default data. Now, in the lower left, click the Layers buton, then Add Layer. For the Datasource field, browse and find the GeoJSON file downloaded from GeoJSON Flickr Groomer. Click Save & Style, and you should see a map of your points on the left side of the screen. To zoom to the area of just your data, reopen the Layers dialog, and click the magnifying lens next to the layer.
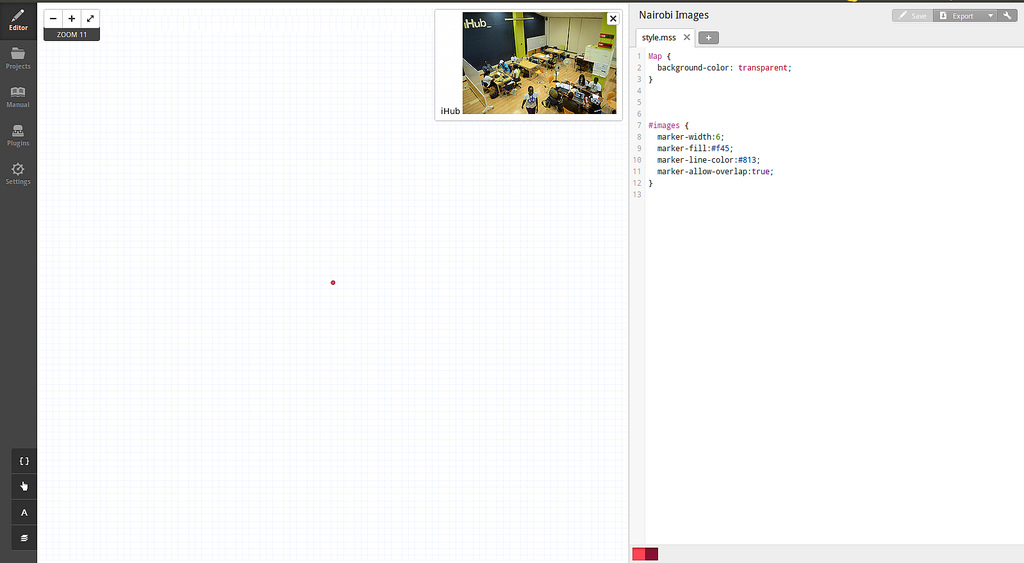
Credit: Mikel Maron
On the right, is CartoCSS, used to style your map. We want to make some small changes, making the background of the map transparent (by default it’s sea blue). Here’s what our CartoCSS looks like:
Map {
background-color: transparent;
}

#images {
marker-width:6;
marker-fill:#f45;
marker-line-color:#813;
marker-allow-overlap:true;
}
Now, add Interactivity, the dialog is reached by clicking the small hand in the lower left tool set. Click Full. Here you can specify what appears when you click on a point. All of the tags for these features from OSM are available, you’ll see them in a list at the bottom of the dialog in “Mustache” tags. We set the content to this below, to show the name of the feature, and a linked photo.
{{{name}}}

The map is ready to share! Sign up for a free account on MapBox. Then back in TileMill, click the Export->Upload option in the upper right, configure the settings for the upload (try to minimize the upload size), and Upload. You can watch the progress of the export and upload, and then get a link to the map.
Results and your challenge
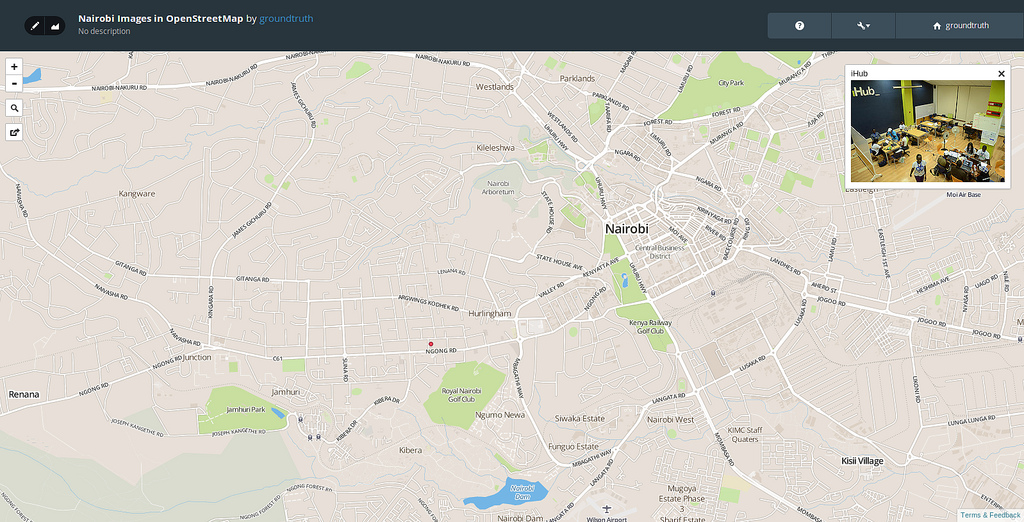
Credit: Mikel Maron
So this is it! To get the streets background, you’ll need to dive a little more into MapBox hosting configuration. Try it out on your own, with say, 10 images. If you have any questions about this guide, suggestions to improve it, or just want to share your results, get in touch. Thanks!