Introduction
The Comma Separated File format, or just CSV, especifies a data type store in a tabular manner. Each line represent a record, and each field is delimited by a comma or another separator character. This format is accepted by popular tools like Excel, LibreOffice and Google Docs, and by most of programming languages. In this tutorial, we are going to learn how to generate a cloropeth map of income of São Paulo residents in QGIS, using a shapefile and a csv file.
Preparation
We are going to use data from 2010 Brazilian Census made by IBGE. Download this file and expand it at a local directory.
Download and install QGIS. This tutorial uses version 2.2, but it is possible to follow the steps using 2.0 version.
Building the map
Open QGIS and add a vector layer from file censo-2010-sp-setores.shp:
Add a delimited layer from file censo-2010-sp-stats.csv:
Join the files by specifying a key field at shapefile properties:
This union allow creating a style based on csv file data:
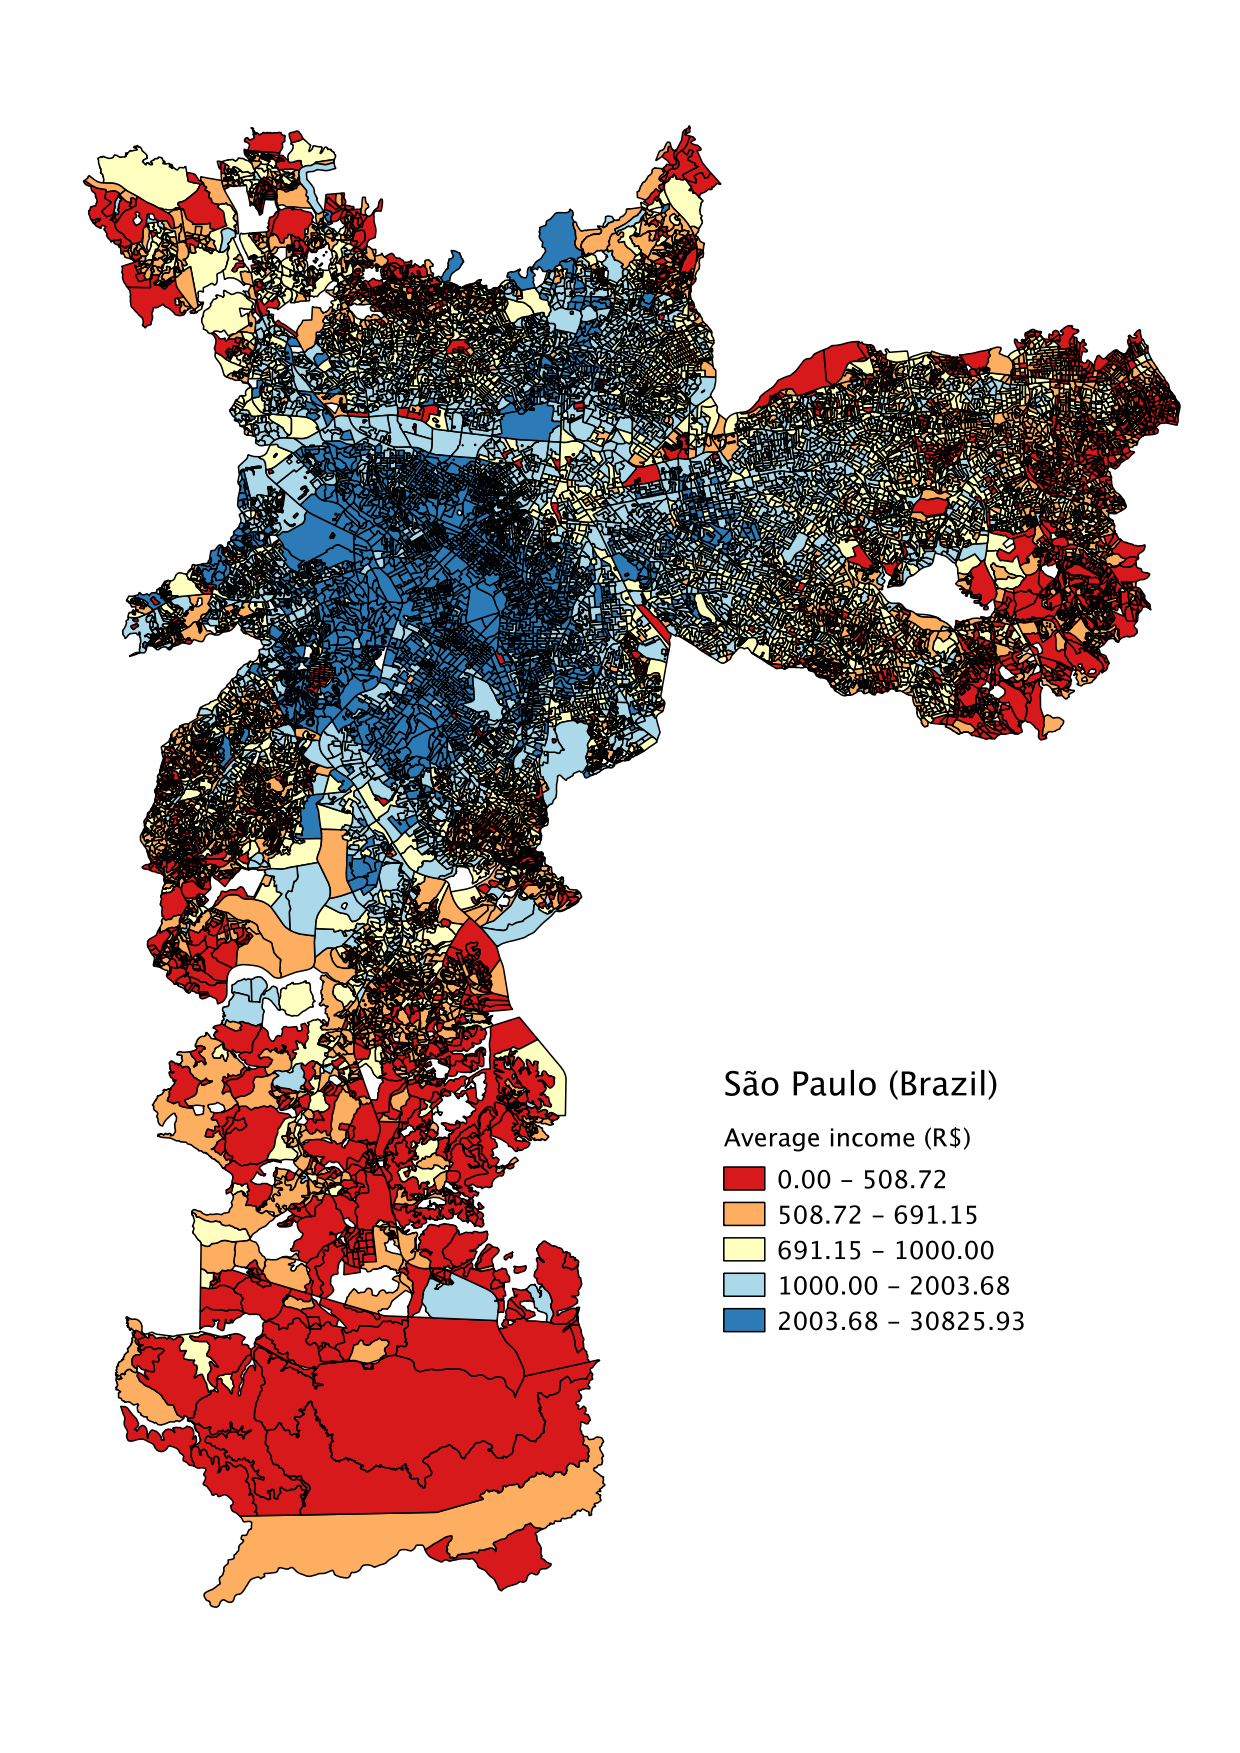
The resulting map
Now you can add a legend and export the map to have a result like this: