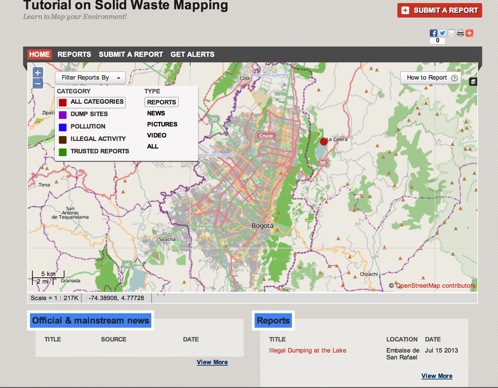
Ushahidi is a great open-source software for presenting many kinds of information on a map. You can set up an Ushahidi site using Crowdmap which will help you tell a story by bringing together a map with the information and reports you choose to include.
Introduction
Ushahidi is a great open-source software for presenting many kinds of information on a map. You can set up an Ushahidi site using Crowdmap which will help you tell a story by bringing together a map with the information and reports you choose to include. The visual presentation of the right kind of information in this way is a great way to immediately impact your audience, and even to invite them to participate in sharing their own information. The front end design is straightforward, and the back end of the software is as simple as can be, making it ideal for a very quick setup and use by people with even a quite basic level of computer skill.
In this tutorial, we’ll map environmental features like garbage collection points, waste disposal problems, current news related to pollution of the environment by solid waste, sewage disposal and stories related to this environmental problem.
Why using Ushahidi?
Using Ushahidi for creating your map of reports can be a quick and easy way to make an interactive visual demonstration of the concepts and news you want to report. However, it’s important not to imagine that the “crowd” will come running to add their own reports to your site. Having in mind a plan for cultivating your reporters, or simply doing it yourself, is a good way to go. If you have a team already, they can easily be trained to add reports while your job is to approve them on the administrative dashboard. If you simply want to visualize information you already have collected, or make a site based on environmental news that you are tracking, you can do this yourself and keep updating.
Another important thing to remember is accessing your audience. Ushahidi can’t be easily embedded into another website that you may have running. You’ll have to direct traffic there. Have a publicity plan in place, or if you are already working online as a journalist, create links with your current site. Also, use Facebook and Twitter to promote each report.
Tutorial Steps
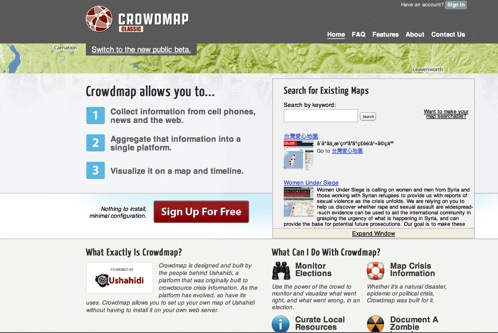
Go to www.crowdmap.com. Scroll to the bottom of the site and click Crowdmap Classic. You should see this:
Create an Account
Click “Sign up for Free”. Fill in your details. Then, carefully choose the map address. If you just want to play and learn, you can make it something like “My Test Map Temp” – but if you think you might really want to share and use this map, give some thought to the title. Then fill in the map title and tagline.
I’ve created this one to demonstrate with. You can also take a look at mine: https://solidwastemaptutorial.crowdmap.com.
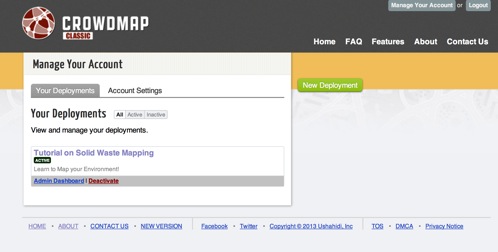
After you’ve created your map, you should see:
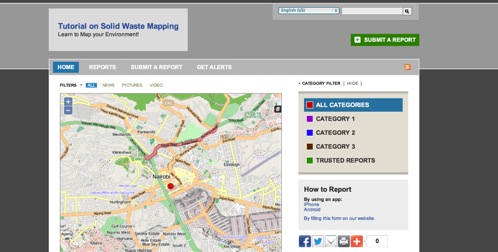
Click on your map and you will see:
Let’s go into the back end of the site to adjust the settings.
Click your browser back button to get back to the previous screen, and under the title of your map you will see “Admin Dashboard” (see above). Click there and you’ll get to your back end management:
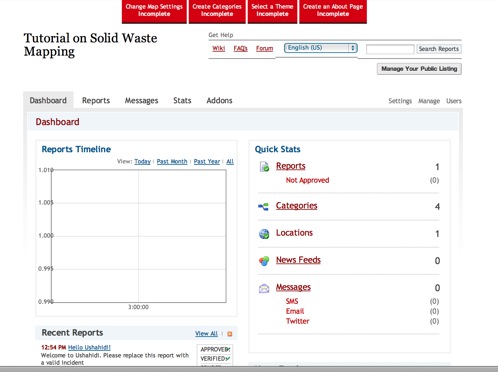
Notice at the top are big red buttons telling you that you haven’t managed some settings. Let’s start with “Select a Theme”. Click there and you’ll find a few custom designs for your map. Pick the one you like best by checking the box Select Theme and then Save Settings.
Now go to Change Map Settings.
You’ll want to pick your country, and then zoom in to see just the area you want in the box. First see if it’s there in OpenStreetMap. If not you can look up in a different map provider in the dropdown menu. For now, that’s enough to get started.
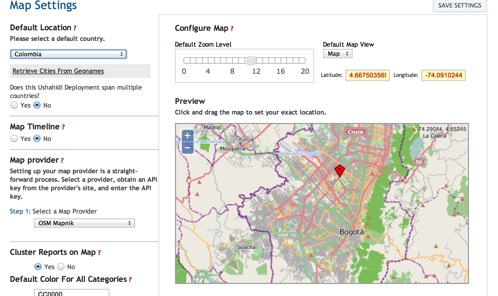
Don’t forget to click Save Settings afterwards!
Adding Categories
Go back to the Dashboard. You will see a menu item on the righthand side, Categories.
Click here and you should see three generic categories. You can change these into your own by clicking Edit. For instance, Dump Sites, Pollution, and Illegal Activity. The fourth category indicates all trusted reports. You can also remove this or any other category. See below:
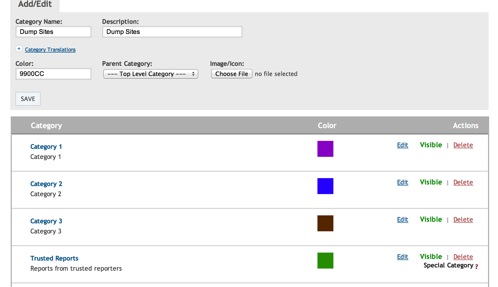
Click Save after you have added your categories.
Next go back to your map’s homepage by clicking on its name on the top left of your screen. You should see the map area you wanted, and the theme you selected. Now you’re ready to start adding some reports.
Adding a Report
Go ahead and click Submit a Report, the big red button. The great thing is anyone can also come to your site and click the same button. You’ll be able to decide later whether to approve and add their report to your map, don’t worry.
Fill in the Title and Description of the event, information, news or whatever you feel is important to include for now. Move the red dot on the map to indicate the location of your report by clicking and dragging in, and zoom in and out of the map using the + and – buttons.
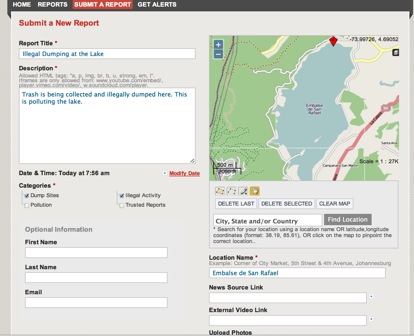
You can select the categories which apply to your report. You can also add your name, optionally. You must add a location name; if you are using OpenStreetMap then don’t use the automatic find location button. Simply name your location as you like. You can also add photos, external video links and news source links. These are useful if you are recording a report that references other news.
Once you’re done, click Submit.
Approving a Report
Go to your Administration Dashboard by clicking in the upper right hand corner of the site on your login email and selecting Your Dashboard.
Then click Reports.
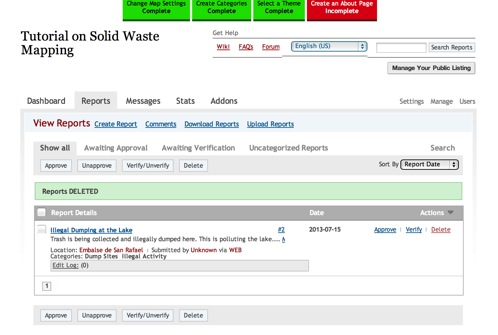
You have two reports there already – yours, and one that simply says Hello Ushahidi!
First of all click Delete on the intro post Hello Ushahidi.
Then click Approve and Verify on the post you just made. Verify means that you are an eyewitness to this report or have sufficient trust in the source to consider it verified. Use your journalistic skills to assess when to use Verify. This allows you to approve reports that other people send in, but distinguish those you can confirm from those you have not yet confirmed.
After it’s approved, you can click on your site homepage again in the top left corner and you’ll see your report!
