The basic component of a map is its layers—an individually designed dataset—that are combined together to tell a story. In JEO 1.o and beyond, maps are built utilizing a layers content type which allows editors to more easily reuse the data they mapped. These layers are organized and configured in combination with a base map that usually consists of place names, roads, and major natural features.
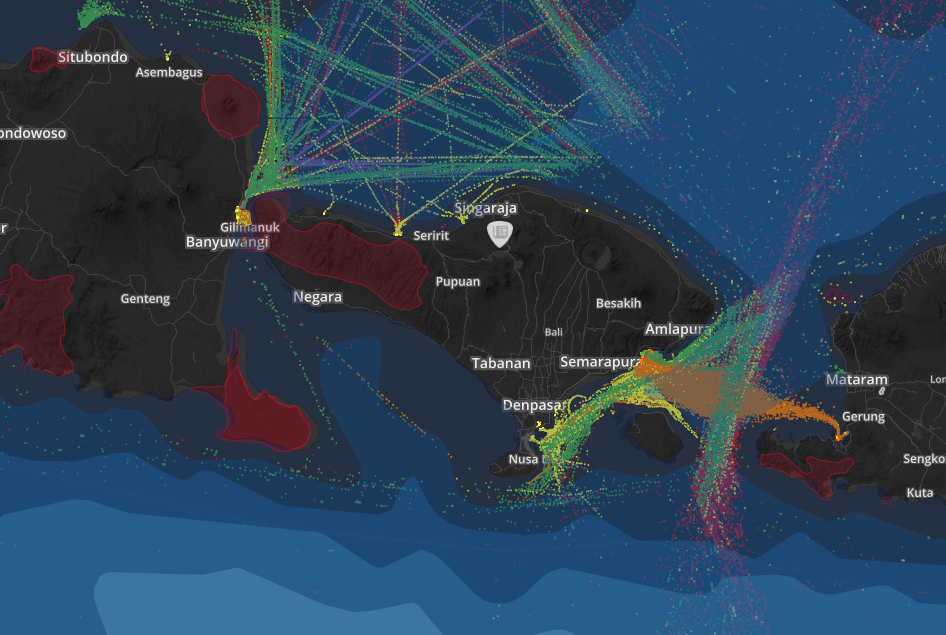
Map of marine traffic in the Java Sea published by geojournalism project Ekuatorial. The basemap focuses on the readers attention on the ocean areas of the map and is used to contexualize data layers showing shipping lanes and marine protected areas.
Add a New Layer
JEO’s maps are created by stacking one or more custom thematic layers on top of a basemap. A thematic layer is made from a dataset that illustrates and provides context to the map. Layers are displayed as tiles that are hosted on external servers and connected with the JEO template through APIs and URLs.
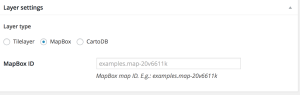
To add more layers, you can use the “Add MapBox layer” and “Add CartoDB layer” buttons if you want to use layers from these servers. Otherwise, use “Add tile layer.” Inside the box that is created after adding a layer you’ll see three fields that need to be filled out:
- Title, which is the name of your layer. It will always be used when you need to refer to this layer (in a menu, for example).
- ID or URL. This is where you should put the URL of the layer, or, in the case of a MapBox layer, your ID.


Each layer contains a field for adding the legend to describes the dataset and show how it is symbolized. The legend needs to be written in HTML and is flexible to accept a number of custom styles. Please see this the InfoAmazonia, Ekuatorial, or Third Pole github repository for some example of how these are written.
Add a New Map
JEO’s maps are created by stacking one or more custom thematic layers on top of a base map. The Maps Content Type is there location where layers are named and organized into Maps. This is done by configuring the “Maps Setup” section of the form. The basic component of a map is its layers—an individually designed dataset—that are combined together to tell a story. These layers are organized and configured in combination with a base map that usually consists of place names, roads, and major natural features.
Choose a Base Layer
The base layer is the layer is bottom most layer in your map; providing a visual foundation for all of the data added on top. There are a variety of already created base maps you can choose from, including:
- OpenStreetMap,
- Mapquest,
- Mapquest Satellite,
- Stamen Toner,
- Stamen Watercolour,
- Stamen Terrain,
- Other (used for when you have your own tilelayer URL)
- None (in case you want to use a base from an already existing layer in your website).
Add and Organize Thematic Layers
The design of the map is closely related to its order of information. One of the most important concepts in cartography is called visual hierarchy. The idea is focused on making the most important information the most visually prominent in the design. Once you’ve identified the most important information you put it on the top and add supporting data underneath.
For example a deforestation map will be ordered like this: forest loss, forest concessions, protected areas, forest height. Layers are displayed according to their visual hierarchy. The higher the layer in the list, the higher its visual priority in the stack of layers that have been added to the map
Within the Map CT, there is a searchable interface for finding and selecting the layers you want to add to your map. These layers were named during the first step of this tutorial. When you select multiple layers, their display order is from top to bottom.

Once you have selected the layers you want to appear in your map, you the select options that control how your audience can interact with your selected layers. The layers can be:
- Fixed – use this if you don’t want to allow the viewer to turn off the layer.
- Switchable – when you want that the viewer to be able to switch the layer on and off.
- Swapable – when you would like to permit a choice between a set of layers.
You can review the map design before publishing by clicking on the “UPDATE PREVIEW” button.
Defining the Center Point, Scale and Scope of the Map
The last step before publishing the map is the “Map Configurations” section. This is located under the preview map window. Here you can set some limits on the where a user can move to within the map (most maps are not global and should be define). There are three ways to hone in on the interaction.
- The center and initial zoom: This is the default view for the map when the page loads.
- The minimum and maximum zoom: This feature allows you to limit the zoom level to a specific range. Sometime data is now very useful at a high zoom level because it is generalized for a regional map. Other times, the scope of data may only cover a single city. If either of these is the case, limiting the zoom levels will help the map load faster.
- The limits for navigation of the map: Similar to zoom limits, if the map is not global in scale then it is important to put limits on “panning.” Panning is the action of moving the map from side (2-dimensions) to side rather than zooming in and out (3-dimensions).

To create these configurations, you can navigate the map and when you are in the position that you desire, click the buttons “Define current as center and zoom” and “Define current as navigation limits”.
Using the other setting, it is possible to:
- Turn off the possibility of using the mouse or touchpad to change the zoom
- Turn on a filter, permitting that the visitors choose the start and end date of the posts which they wish to see
- Turn on a search field on the map