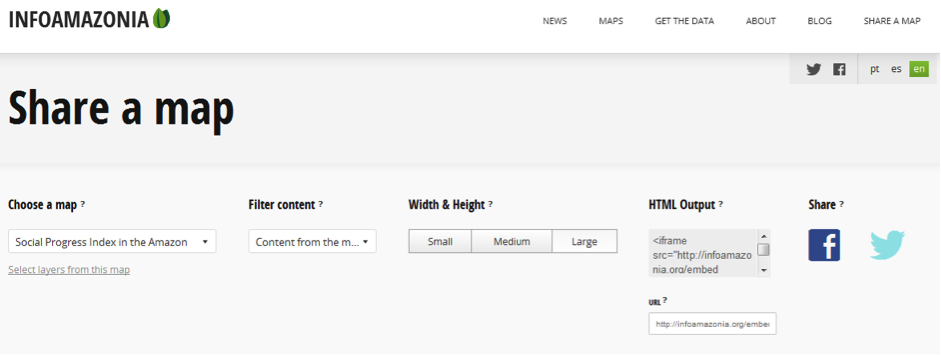
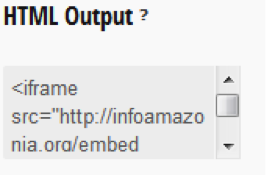
Not everyone has the time, money, or inclination to make interactive maps to support their stories. With this in mind, we’ve added a sharing feature to help journalists tell environmental stories with the maps they see within GeoJournalism sites. This tool creates an interface for formatting an iframe embed code; similar to a YouTube video embed.
All of the sites using JEO have the capability to use this tool but not all of the sites enable the feature. Among the GeoJournalism sites on the Open Earth platform, you can embed interactive maps from InfoAmazonia.org, InfoCongo.org, Oxpeckers.org, and TheThirdPole.net.
Let’s walk through this process using The Third Pole and InfoAmazonia
Getting to know “Share A Map” Settings
Using this tool, you have the ability to select and customize the map data, filter or remove the geolocated story content, and chose the size of the map.
Select the map
The first step is to chose the map you want to share. Each map hosted on the site is available by clicking the drop down menu. you can choose multiple layers from this map by clicking “select layers from this map.” This is useful is you need to remove unnecessary information.
Customize the Story Posts
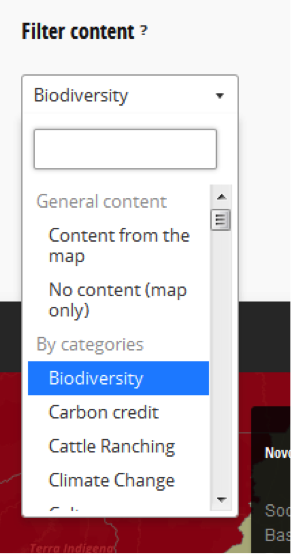
Select the filter content tab to select the content that will be displayed on the map. You can either select to include “general content” which includes all stories tagged to the map by the site editors or remove the stories. It is also possible use “by categories” to filter content to only include specific topics.
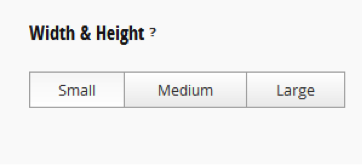
Choose the preferred size of the maps (small, medium, large)
It’s possible to customize the map to be shared at any size. We included these 3 “width and height” options to make it easier to customize and preview without needed to write in the iFrame HTML. Clicking between the map sizes will dynamically change in the map preview area.
Pan and zoom to the view you wish to share
One of the most useful features of this tool is that the center of the map and the zoom level information are included in iframe HTML code. This means that detailed regional maps, like InfoAmazonia’s deforestation maps, can be used to support stories about more local examples of deforestation.
Share!
Now that you’ve customized your way to the map you want, there are three options to share you selection.
