by Rollin Hu
Monitoring the state of the world’s forests is a monumental task with challenges in data collection, interpretation and display. The Global Forest Change (GFC), a project developed by Professor Matthew Hansen of the University of Maryland´s Geography Department, tackles this issue by using algorithms to distinguish forest cover and change in satellite imagery.
From this data, GFC is able to display trends in forest cover loss and gain over time. Hansen, a remote sensing scientist with a specialization in land use change mapping, has also contributed greatly to other monitoring projects such as the Global Forest Watch, an interactive online forest monitoring and alert system. In the realm of media and Geojournalism, this work provides highly detailed maps of the state of the world’s forests. This information is especially important in places where forests are at risk, as covered by news sites such as InfoCongo and InfoAmazonia.
At InfoAmazonia, we are excited to announce the integration of GFC’s data into our media platform.
See our map here using GFC data
On this interview, Professor Hansen tells more about his work.
The Global Forest Change (GFC) displays a world map with data on forest cover, loss and gain over different years. What was the process in creating GFC?
Matt Hansen: Well, you have to have really good imagery so we had a NASA and USGS (US Geological Survey) satellite series called Landsat that is really well engineered and provides time-series images of the Earth. We’re really good at processing that data, extracting thematic information like where trees are, where they aren’t, where they’re lost and where they’re gained. The kind of expertise that you need, you need to be a geographer, have to know something about environmental science, have to be able to interpret images, process images, do some programming, be good at math and statistics, so it’s a very interdisciplinary skill set. But in the end, the satellite is taking the picture very similar to the way our eyes look at the world. We know a forest because we see a certain pattern and that process is very similar for the satellite.
So we try to train an algorithm to identify trees and then we train it to see when the trees are gone and when they grow back.
What are important distinctions or contributions that GFC is able to provide?
MH: It’s the first [forest monitoring system] in 30-meter resolution. We divide the world up into 30 meter squares, so you’re at a scale at which humans act on landscapes. So when they clear cut, we see it very clearly, so that’s the first thing. It’s the first global land change record at that spatial resolution, now for fourteen years. We will process it every year moving forward and we will develop trends on which way things are progressing. We’ll see if deforestation rates are going up or if regrowth patterns are changing. There are so many different amazing stories in forests globally and this resolution in this product helps us track and quantify those stories.

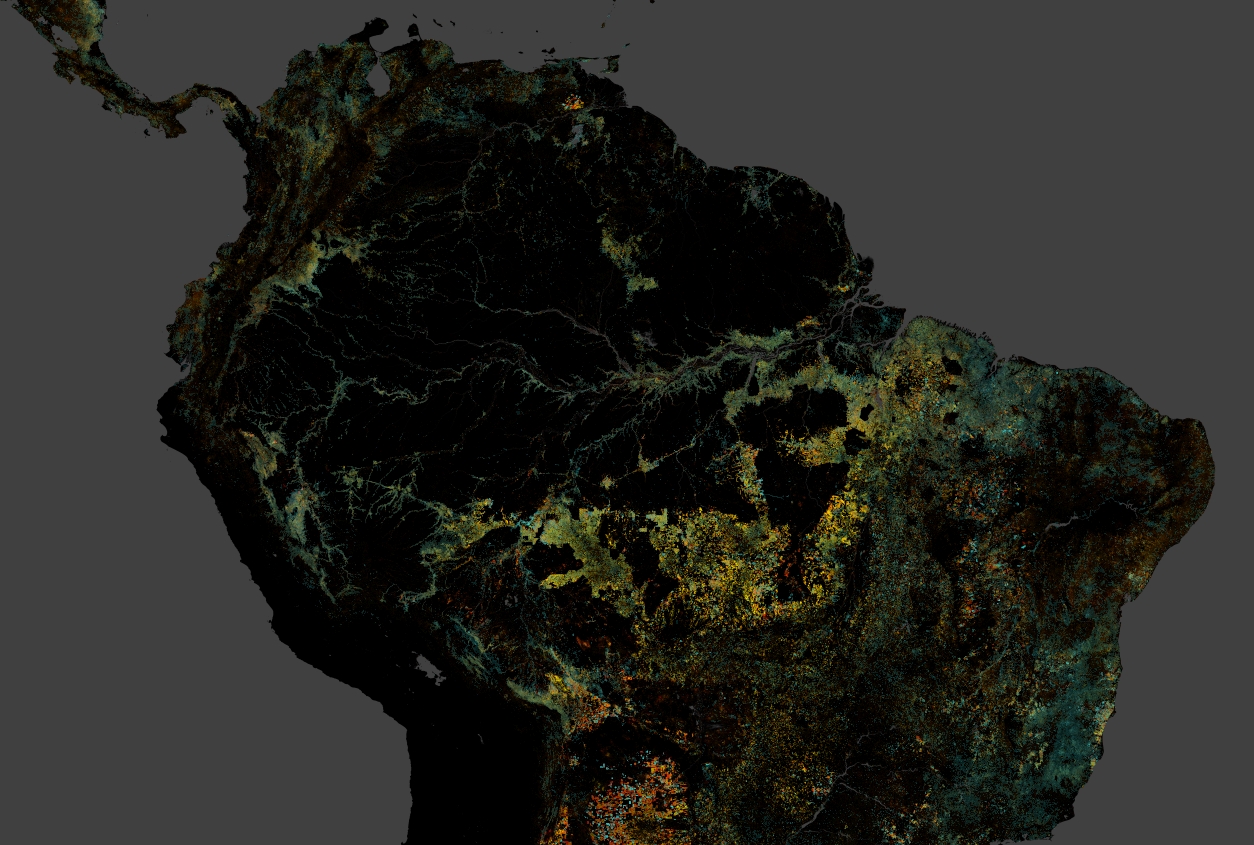
View of the Global Forest Change Map – See online at
https://earthenginepartners.appspot.com/
There has been some criticism that GFC classifies any vegetative growth higher than five meters as a tree and therefore counts plantation trees as forests. How do you plan on differentiating between vegetation higher than 5 meters such as plantation forestry and natural forests?
MH: Plantations will be identified soon. It’s kind of intuitive. If you have trees systematically coming and going in a landscape, we can draw a line around that and call that a plantation. That’s not going to be a problem. The real problem is that we need to get a long enough record. We’ll have a place like Sweden that might have slower regrowth than places like Indonesia. We need a longer record to get net change. We will get the net change dynamic.
We will identify the landscapes where trees are a crop and reforestation and afforestation differences will come out. Even on a spatial scale, if you look at our website, and you look at the RGB where the trees are green, loss is red, gain is blue and pink is both loss and gain, you see the plantation landscapes. They are really obvious. Southeast US, it’s really pink. It’s all green, red and blue, then pink, then green, red and blue, then pink. These are the landscapes where trees are crops. It’s not hard to imagine us putting some work in there and formally defining them.
How do you see GFC impacting the policies of countries at the hotspots of deforestation in places such as the Amazon, the Congo and Southeast Asia?
MH: I always give Brazil a lot of credit because they stand alone for having a policy that has fought deforestation, especially to the degree it has, from almost 30,000 square kilometers [of deforestation per year] down to 5,000 per year. That’s still a lot but it is great progress. So the question is, is it sustainable and can they keep pushing it down? They do have aspirations to keep doing that.
Other countries don’t have anywhere, I think, close to the maturity of the monitoring capabilities yet to do what Brazil has done. Other countries have more often been increasing their forest clearing and that includes other Amazon basin countries such as Peru and Bolivia. The question is who is going to follow Brazil’s lead?
When you compare Brazil and Indonesia, Indonesia passed Brazil in 2012 [in deforestation rate] and Brazil has a lot more forest left than Indonesia. Indonesia clears more primary forest than Brazil with less than a quarter of the rainforest area. Then you go to a place like the Congo and the Congo has 3,500 square kilometers per year and that is not agro-industry. That is just people, small-holder farmers and that is an amazing thing [that the deforestation rates are] approaching the scale of Brazil.
So each place is different with very interesting sets of drivers and trends. I think, in general, Latin America has the capacity, the civil society [to combat deforestation]. I think they have a more multi-stakeholder approach.
If I were to predict where forest conservation and economic development would be better balanced in the future, it would be Latin America. In Africa and Southeast Asia, it is not so clear in terms of that kind of balance they have between appropriating the natural forest and serving it.
Deforestation is an important factor to track when looking at the health of forests. However, forest degradation, or the loss of quality in forests, is also a very important factor. How can GFC track forest degradations?
MH: It depends on how you define degradation but in our change map, there are a lot of degradation dynamics. We see fires, that may or may not be crown fires. We see logging which depends on the intensity of the logging, but a lot of logging in the tropics is selective not a clearing. That’s a degradation. A lot of small holder agriculture is not truly deforestation, it’s rotational shifting cultivation and that is called degradation.
So we see a lot of degradation and then a degradation that can be indirectly mapped with our product is fragmentation. So when you have a big clear cut in a rainforest, it bleeds the humidity and creates an edge effect. That edge effect leads to the degradation of a certain buffer around the clearing and our product, because it maps the edges well, can quantify it. So there’s a lot of aspects of degradation that are in our map. For sure there’re certain small exploitations that we miss such certain selective logging activities. We don’t see every tree that’s removed at every pixel.
One of your more recent projects – GLADS – is the development of a forest alerts system. How does this add to your overall work?
MH: The alerts are a product just like the annual updates. The annual updates are meant, in the end, when we get really good at this, to be something like an area estimator. There’ll be a map, just wall-to-wall, and should be taken and used for looking at trends and that sort of thing. The alert system is in between annual updates. We are trying to report disturbance as we see it. We don’t report the entire globe every week but we will report where we have good data. It’s designed to have near real time actionable information where you could see a road going into a national park or what have you. If a government or some agency sees something that looks like illegal logging, it’s meant to be fast enough so you could go down to the landscape to see what’s going on.
The GLADS weekly forest alerts
With the increase in commercial satellite companies such as Planet, do you see improvements in data gathering?
MH: The commercial companies are offering some pretty cool data in terms of spatial data and Planet plans to have very high temporal frequency. For us, the data could be use in research in terms of what information you gain out of those sort of observations. They could be used to either calibrate or more importantly validate our Landsat products so I think there’s a role for them. But, the idea that we would be able to map the globe with them is very far off in the future if ever. The value of our USGS, NASA and Landsat data is that it is free and that means we could use it all globally and that is going to be a hard thing to imagine with a commercial data set.
How do you see your work in forestry monitoring impacting Geojournalism and just media in general?
MH: Global Forest Watch was built for this kind of purpose for getting information out to the world, hopefully to improve governance and natural resource management. When you look at the user base, the media is, I think, their greatest one user so what we’ve done is brought transparency to the biophysical dynamic, the biophysical reality of what’s happening in a forest. I think what’s happening is media is taking it and telling those stories.
There are other users like businesses, industry is using it. NGO and governments are not really the big users. They typically like to generate their own data. I think media is huge, it’s great. Data and stories don’t reach some places very easily so the media serves that purpose.


